They make plain stats look polished fast.
Get A Done-For-You PLR 'AI System' that...
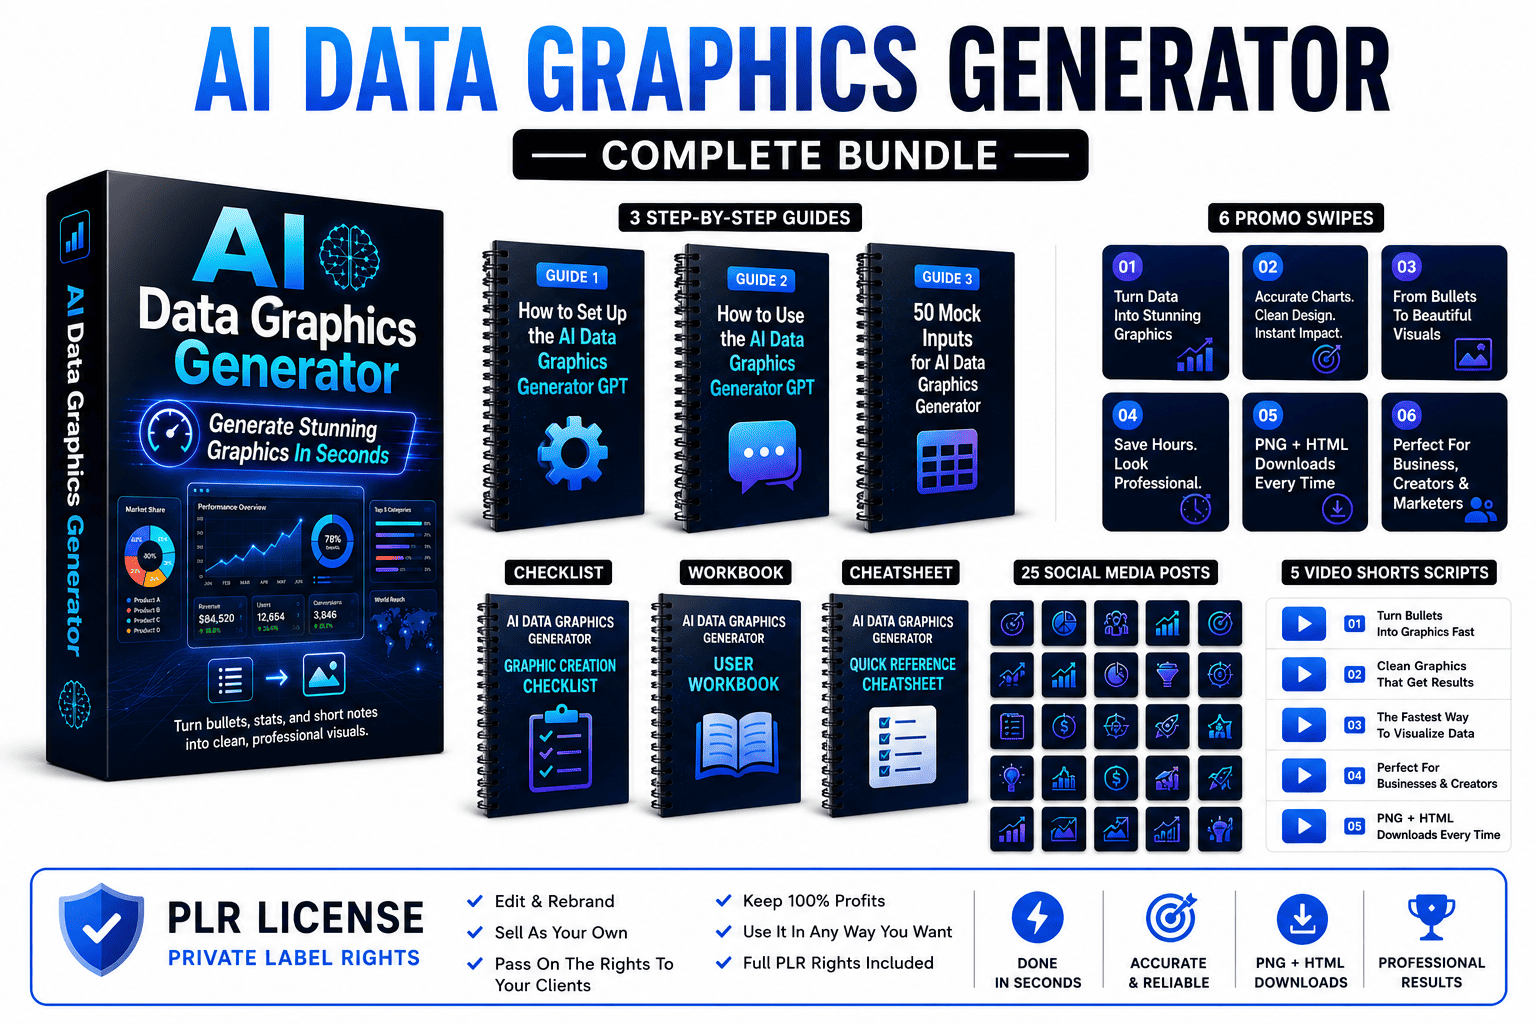
Turns Any Text Block Into Stunning, Full-Color Data Graphics, Ready To Deploy, Use, Sell, Or Giveaway in Seconds!
This Is All Your Clients Need To Create Attractive Data Visuals, Without Putting In The Work!
Please note: The dimesale started at $9.95 until we hit $27. The longer you wait, the more you'll pay!
.
Hey there, trending-hot PLR seekers!
A lot of people are drowning in data but starving for clarity. They have stats, notes, checklists, campaign results, and AI-generated insights sitting everywhere, yet most of it still looks like a wall of text.
The problem is not the data. The problem is the visual packaging.
That's exactly why I built My AI Data Graphics Generator—to transform your raw data into clear, compelling visuals instantly. You give it bullets, stats, notes, paragraphs, or even raw campaign data. Then it turns that text into a polished, custom, full-color data graphic.
This is not data analysis. It is not number crunching. It is not strategy. The system preserves the original wording and numbers while improving layout, hierarchy, color, spacing, and visual flow.
That matters because most people do not need more data. They need the data they already have to look better. They need it to feel finished, professional, and ready to share, sell, bundle, or present.
Most people get stuck because they keep staring at messy spreadsheets and text files. They tweak chart types, change colors, and still end up with something that looks confusing. This system gives them a clear endpoint. One block of text in. One clear data graphic out.
What This System Actually Produces
The output is not a rough design suggestion. It is a finished PNG data graphic with stronger visual hierarchy, cleaner spacing, and a more professional, easy-to-digest presentation.
The system can create dashboards, build bar charts, organize checklists, style process diagrams, and preserve your key message before delivery.
It does not dump your data into a generic template. It designs around the content’s structure, using one of ten professional style guides to ensure a high-quality result.
That makes each graphic feel custom instead of recycled.
Because the structure is repeatable, the system is easy to use again and again.
You can use it for your own content, sell it as PLR, bundle it with other offers, or let clients use it to visualize their own data.
The value comes from speed, clarity, and consistency.
Why This Matters For PLR And Client Work
Clients do not want raw data dumps. PLR buyers do not want another plain text file. Marketers do not want their campaign results looking amateur. Coaches do not want frameworks that feel confusing.
They want assets they can use immediately.
My AI Data Graphics Generator turns ordinary text into polished data graphics without forcing users to become designers. That is the big win.
Instead of delivering raw numbers, you deliver finished-looking insights. That changes how the work is perceived.
You are no longer selling a file. You are selling clarity, professionalism, and understanding.
Why I Built My AI Data Graphics Generator
This system exists because most tools stop too early. They can give you data, but they don’t make the final graphic look premium. They can generate stats, but they leave the visualization problems behind.
That final design stage is where most data gets lost.
Hero metrics get buried. Key takeaways are unclear. Charts are hard to read. Checklists lose their flow. Contrasting ideas get separated. The core message is weakened.
My AI Data Graphics Generator was built to remove that mess.
The result is simple. One source text becomes a polished full-color data graphic, ready to use, sell, deliver, or bundle.
No data analysis.
No complex tools.
No design skills required.
The Harsh Truth: ChatGPT Alone Gives Inconsistent Graphic Results That Waste Time and Energy
Here’s what nobody admits: relying only on ChatGPT for visuals without a framework is a productivity killer. Sure, it can generate code or ideas, but half the time they’re inconsistent, off-target, or flat-out unusable. You ask for a simple bar chart and it gives you a pie chart. You need clarity, but you get clutter. You want speed, but you waste hours fixing its mistakes.
That’s not just annoying—it’s costly. Time wasted means opportunities lost, reports delayed, and social media posts missed. And the longer you stick with “hit-or-miss AI,” the more you fall behind competitors who move faster.
Now picture this: instead of hours of trial and error, your own GPT—set up for a single, laser-focused task—delivers exactly what you need in seconds. Crisp. Consistent. Reliable. No hand-holding, no rewrites, no frustration.
While others are still wrestling with prompts, you’re already done and moving on to your next win. That’s the power difference between using only ChatGPT versus My AI Data Graphics Generator.
This System Makes Professional Data Graphics
These data graphics help existing content feel more valuable with minimal effort.
They help users share data with more confidence.
They improve clarity without changing the numbers.
They make reports, social posts, and presentations feel more finished.
Who Benefits From 'My AI Data Graphics Generator'?
PLR sellers
Want polished data graphics instead of plain text files.
Client service providers
Need fast data visualizations for customers.
Affiliate marketers
Want social media graphics and post visuals that look more professional.
Agency owners
Want cleaner reports, dashboards, and client updates.
Freelancers
Want a repeatable data visualization service.
Product creators
Want marketing graphics that feel more valuable.
Course creators
Need polished visuals for lessons, frameworks, and case studies.
Coaches and consultants
Want better-looking client results and framework graphics.
Bundle builders
Want their assets to look finished and clear.
Data-driven marketers
Need fast graphics for reports and campaigns.
Social media managers
Want stronger, data-backed visual content.
Rebranders
Want a premium-feeling GPT they can package and sell.
Content-heavy marketers
Are tired of text-only posts.
Beginners
Want beautiful data graphics without learning design.
Anyone with data
Wants a fast way to turn existing stats into polished graphics.
How My AI Data Graphics Generator Works
Watch your raw text transform into a finished premium graphic in 8 automated steps.
1
Step 1 — Paste your content
- The user provides their content—bullets, stats, notes, paragraphs, tables, or campaign data.
2
Step 2 — Preserve the original wording
- The system does not invent facts or change numbers.
- It identifies the key items and preserves them.
- The source wording and values stay intact.
3
Step 3 — Pick a style or add custom colors
- The user chooses from one of 10 professional styles or provides their own custom color palette to guide the visual design.
4
Step 4 — Detect the content type automatically
- The system identifies what kind of content it is.
- It could be a checklist, a process, a set of metrics, a comparison, or an editorial insight.
5
Step 5 — Build a custom visualization plan
- Before rendering, the GPT silently plans the visual direction.
- It chooses the best graphic type—dashboard, bar chart, process cards, or checklist—and the optimal canvas size.
6
Step 6 — Generate the full designed PNG
- The system creates one finished full-color PNG graphic by default.
- No half-finished sample. The goal is simple: generate the finished graphic.
7
Step 7 — Inspect the output for clarity
- After rendering, the GPT checks the graphic for layout problems.
- It looks for unreadable text, weak contrast, broken lists, or crowded layouts.
8
Step 8 — Repair layout issues before delivery
- The system reflows sections, fixes spacing, protects data integrity, and checks the graphic again to ensure it's clear and accurate.
Let Me Show You How Fast & Easy It Is To Use:
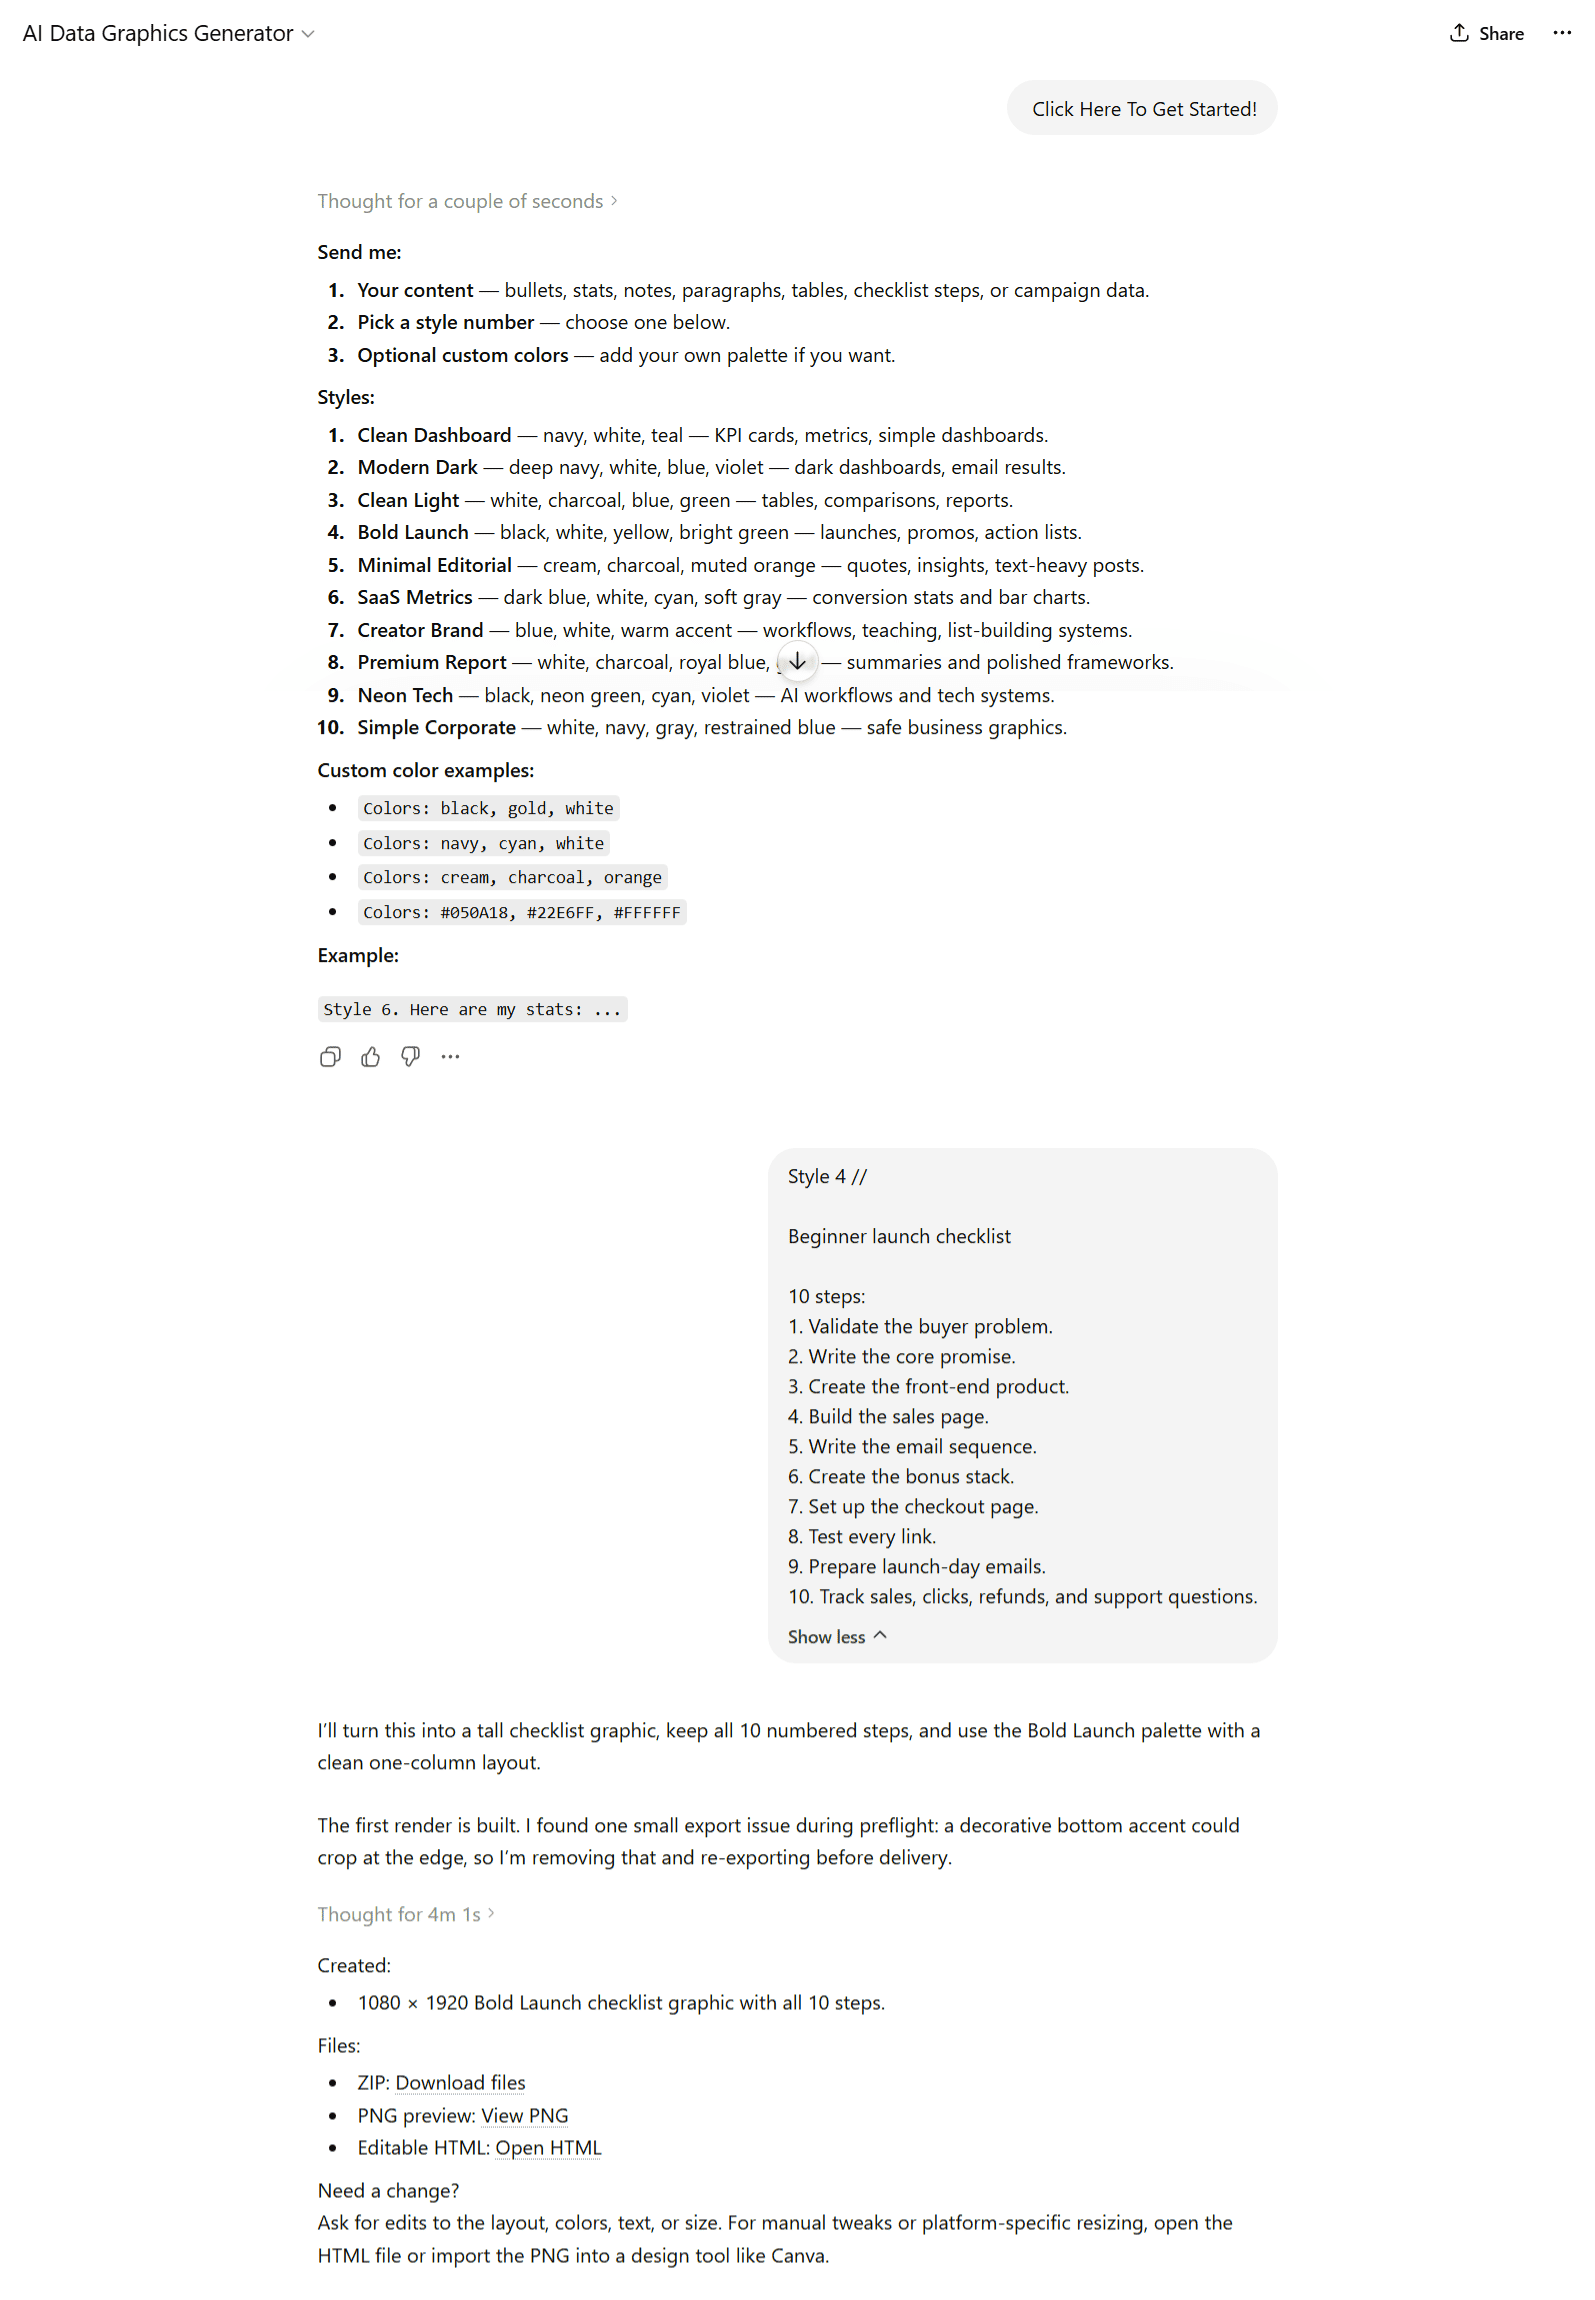
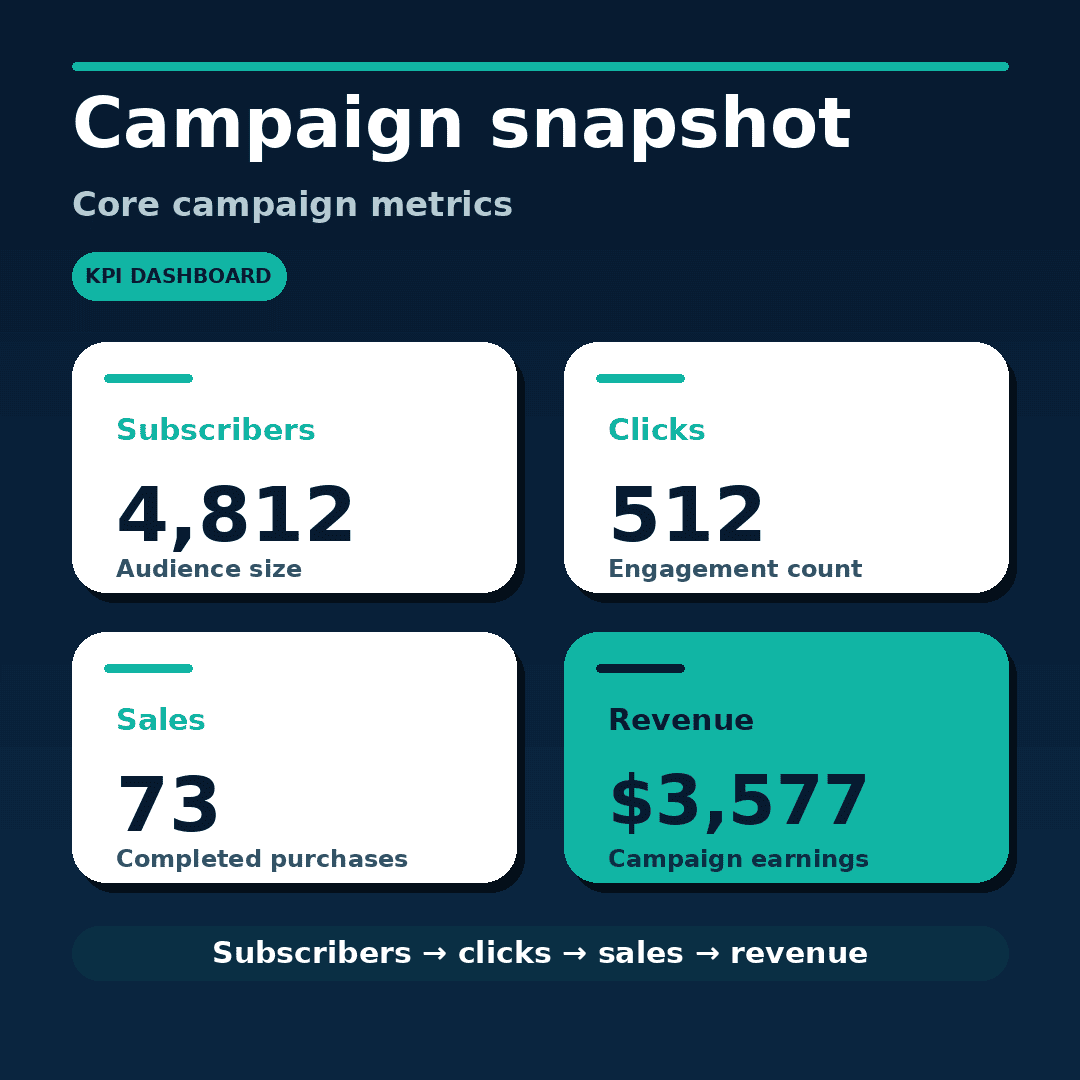
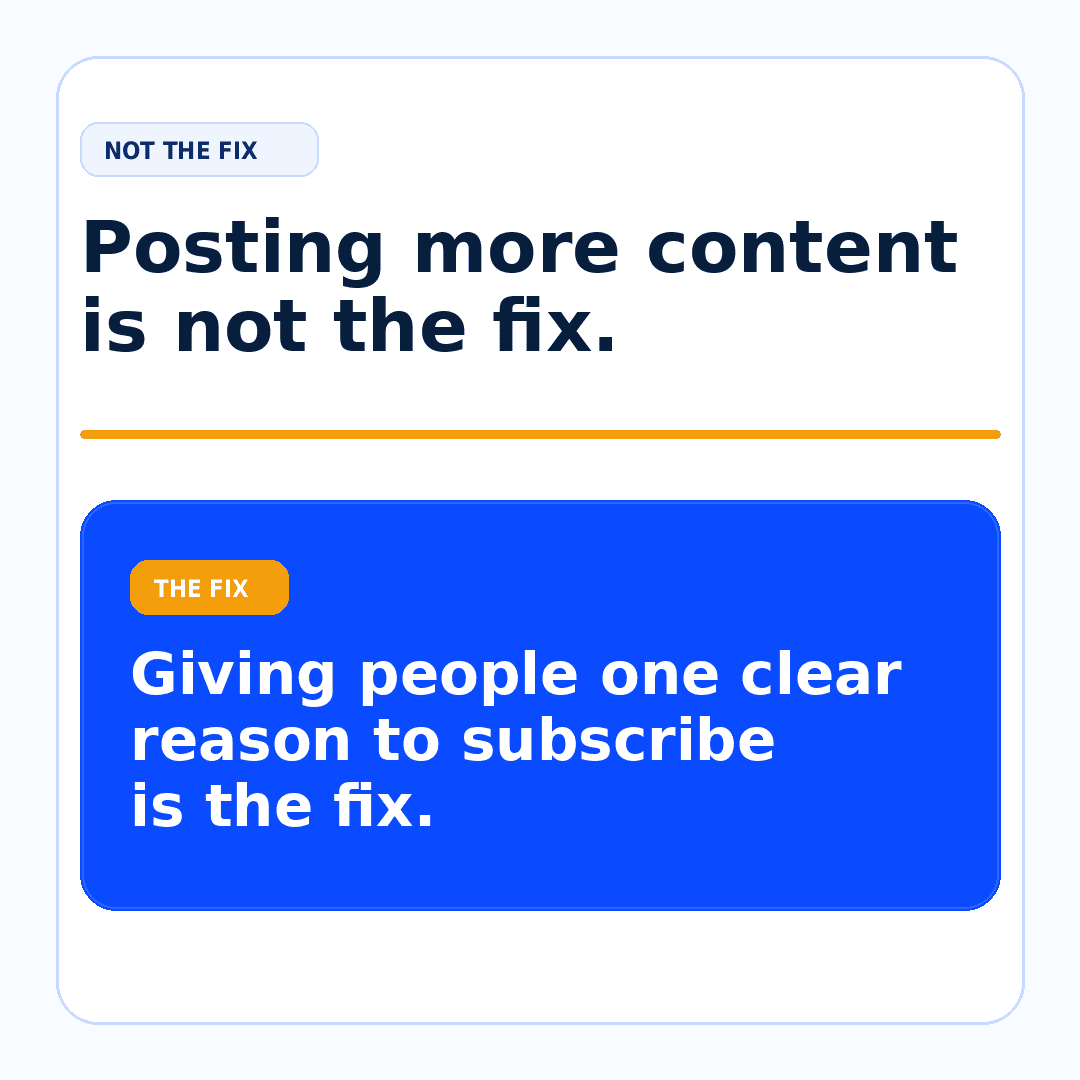
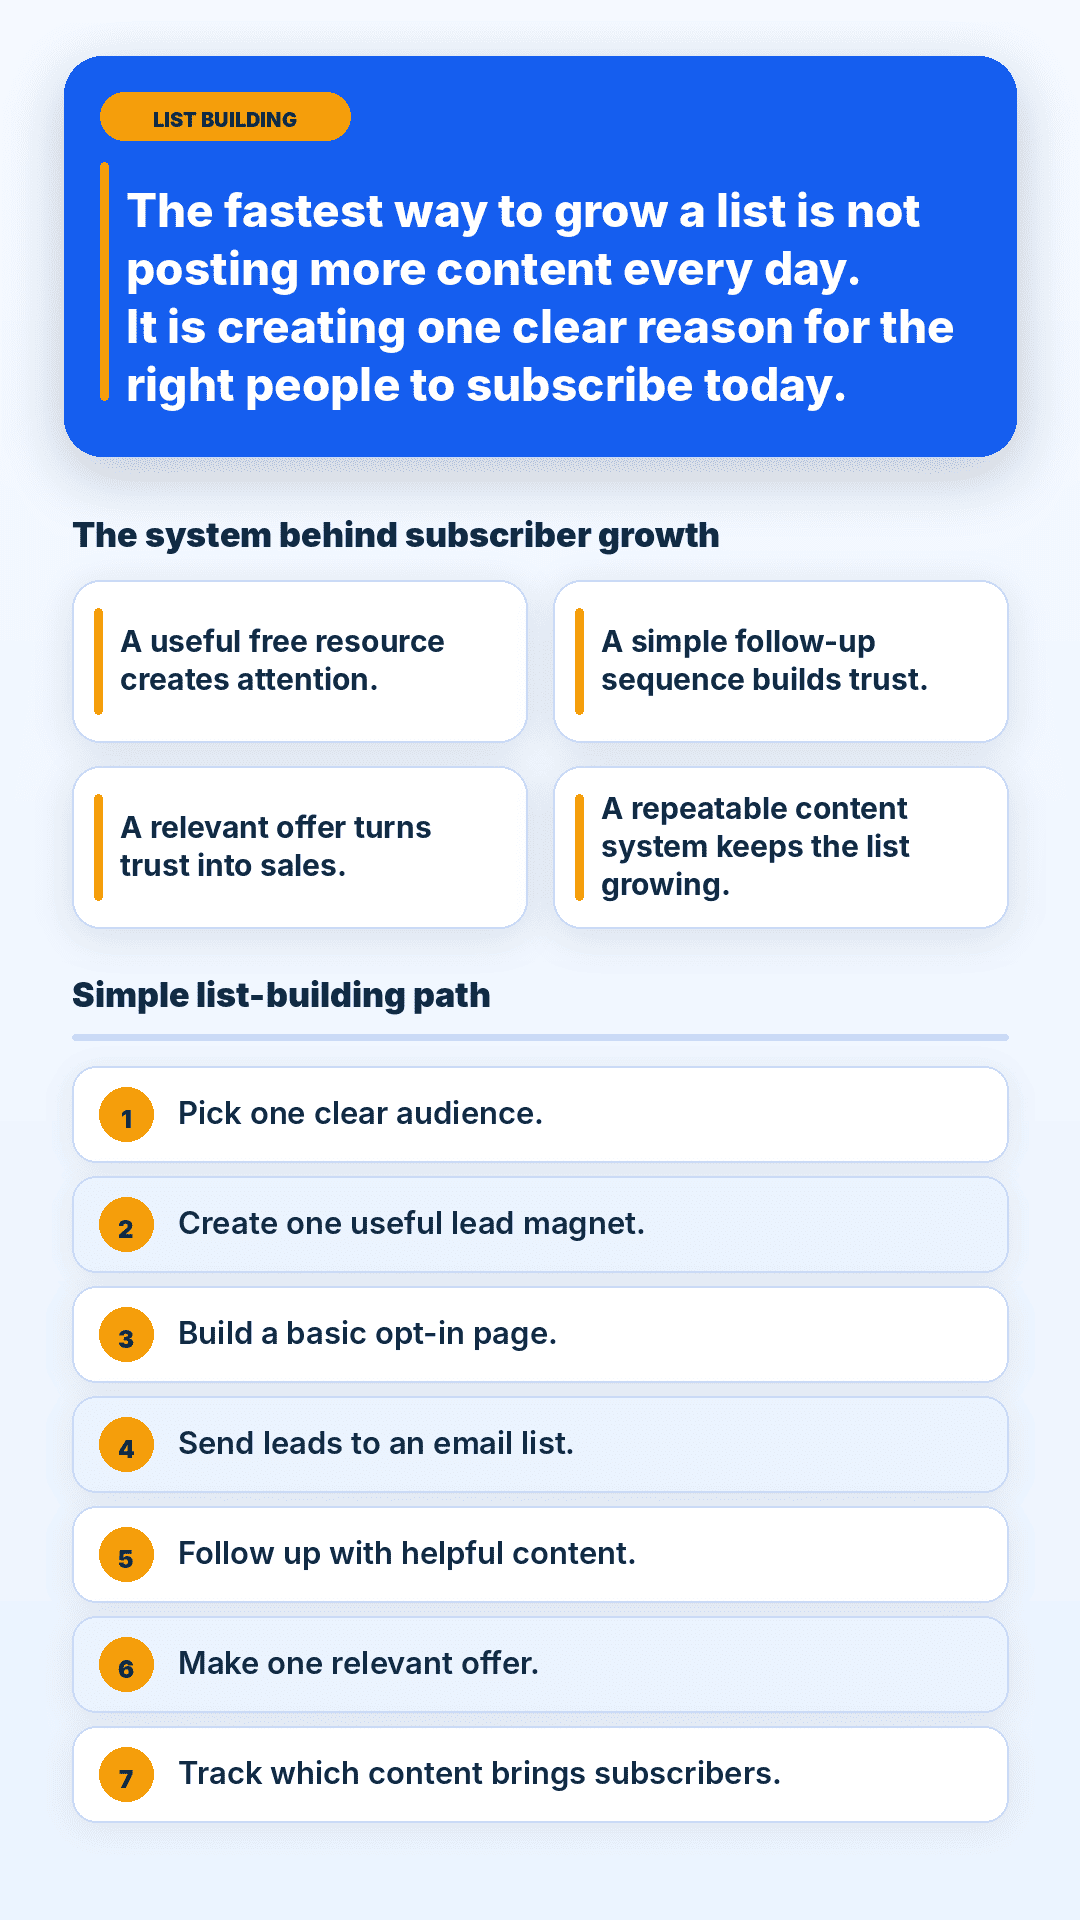
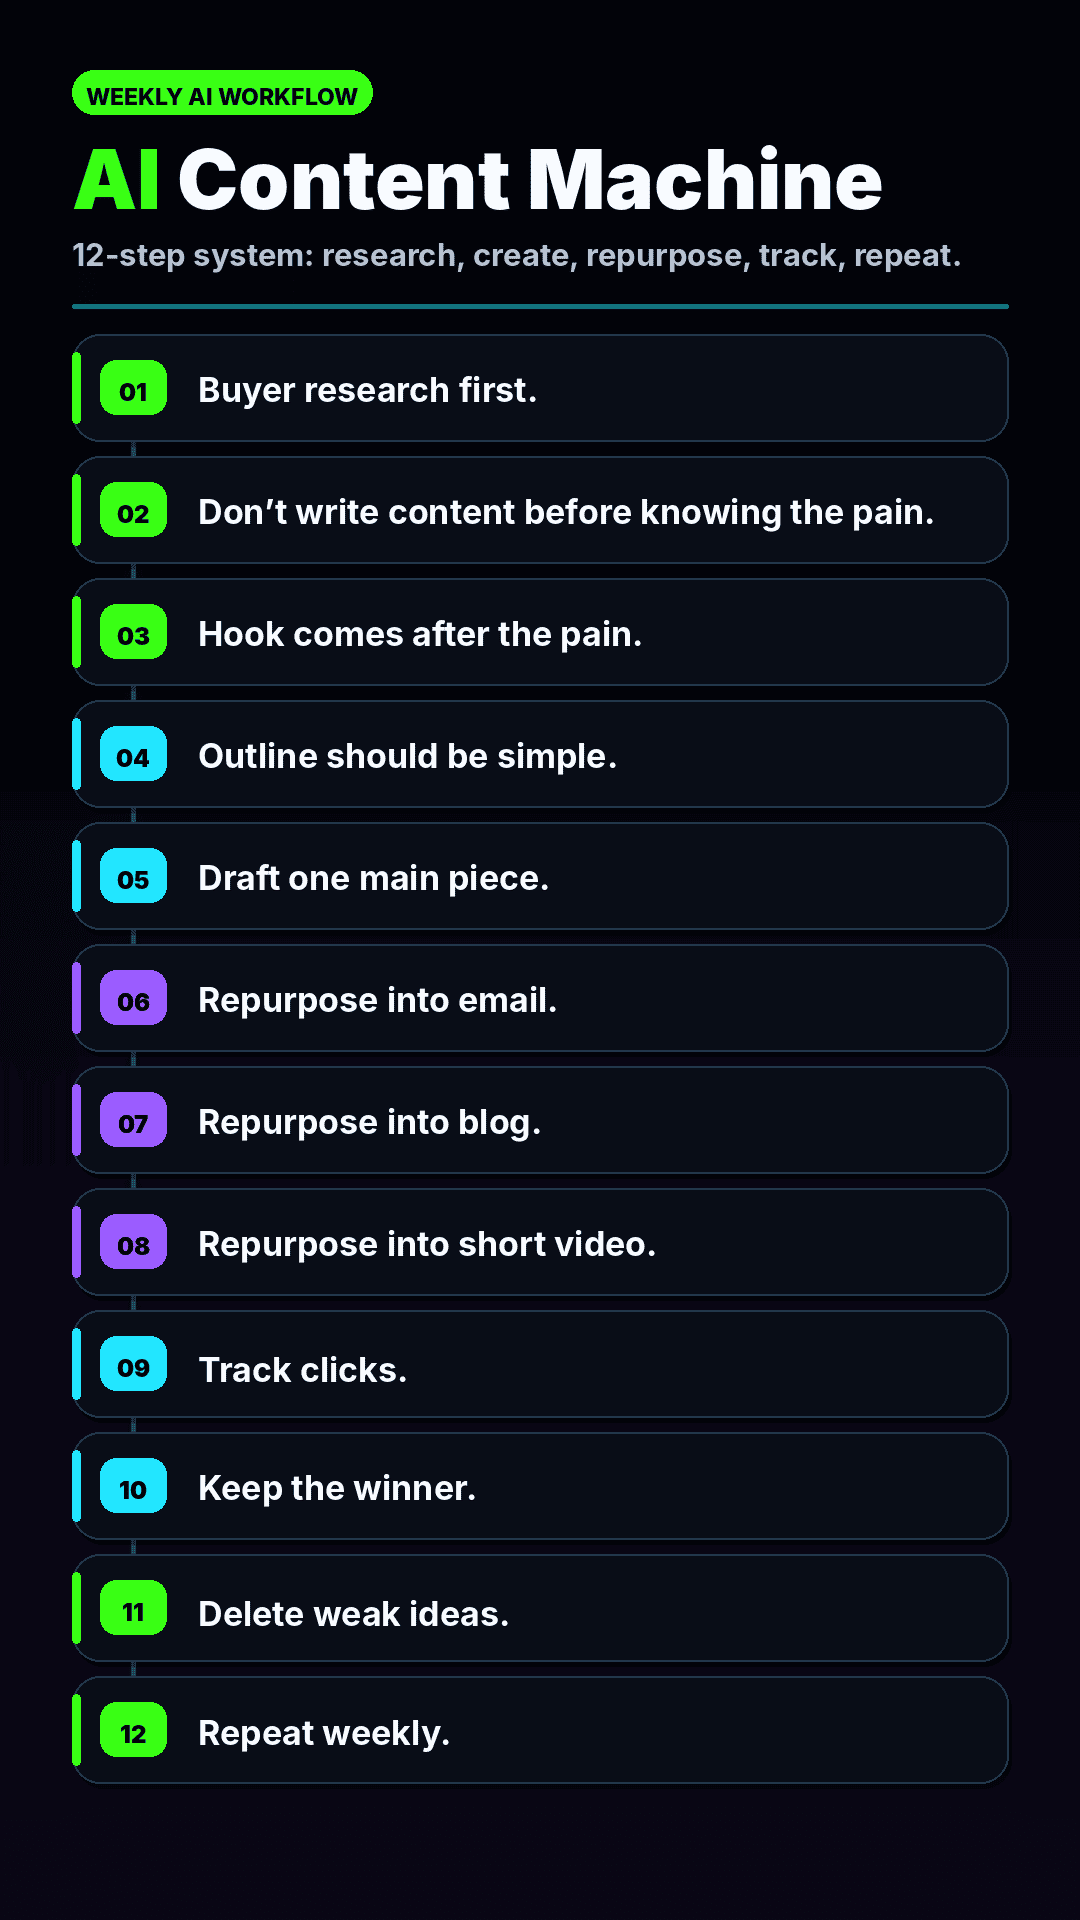
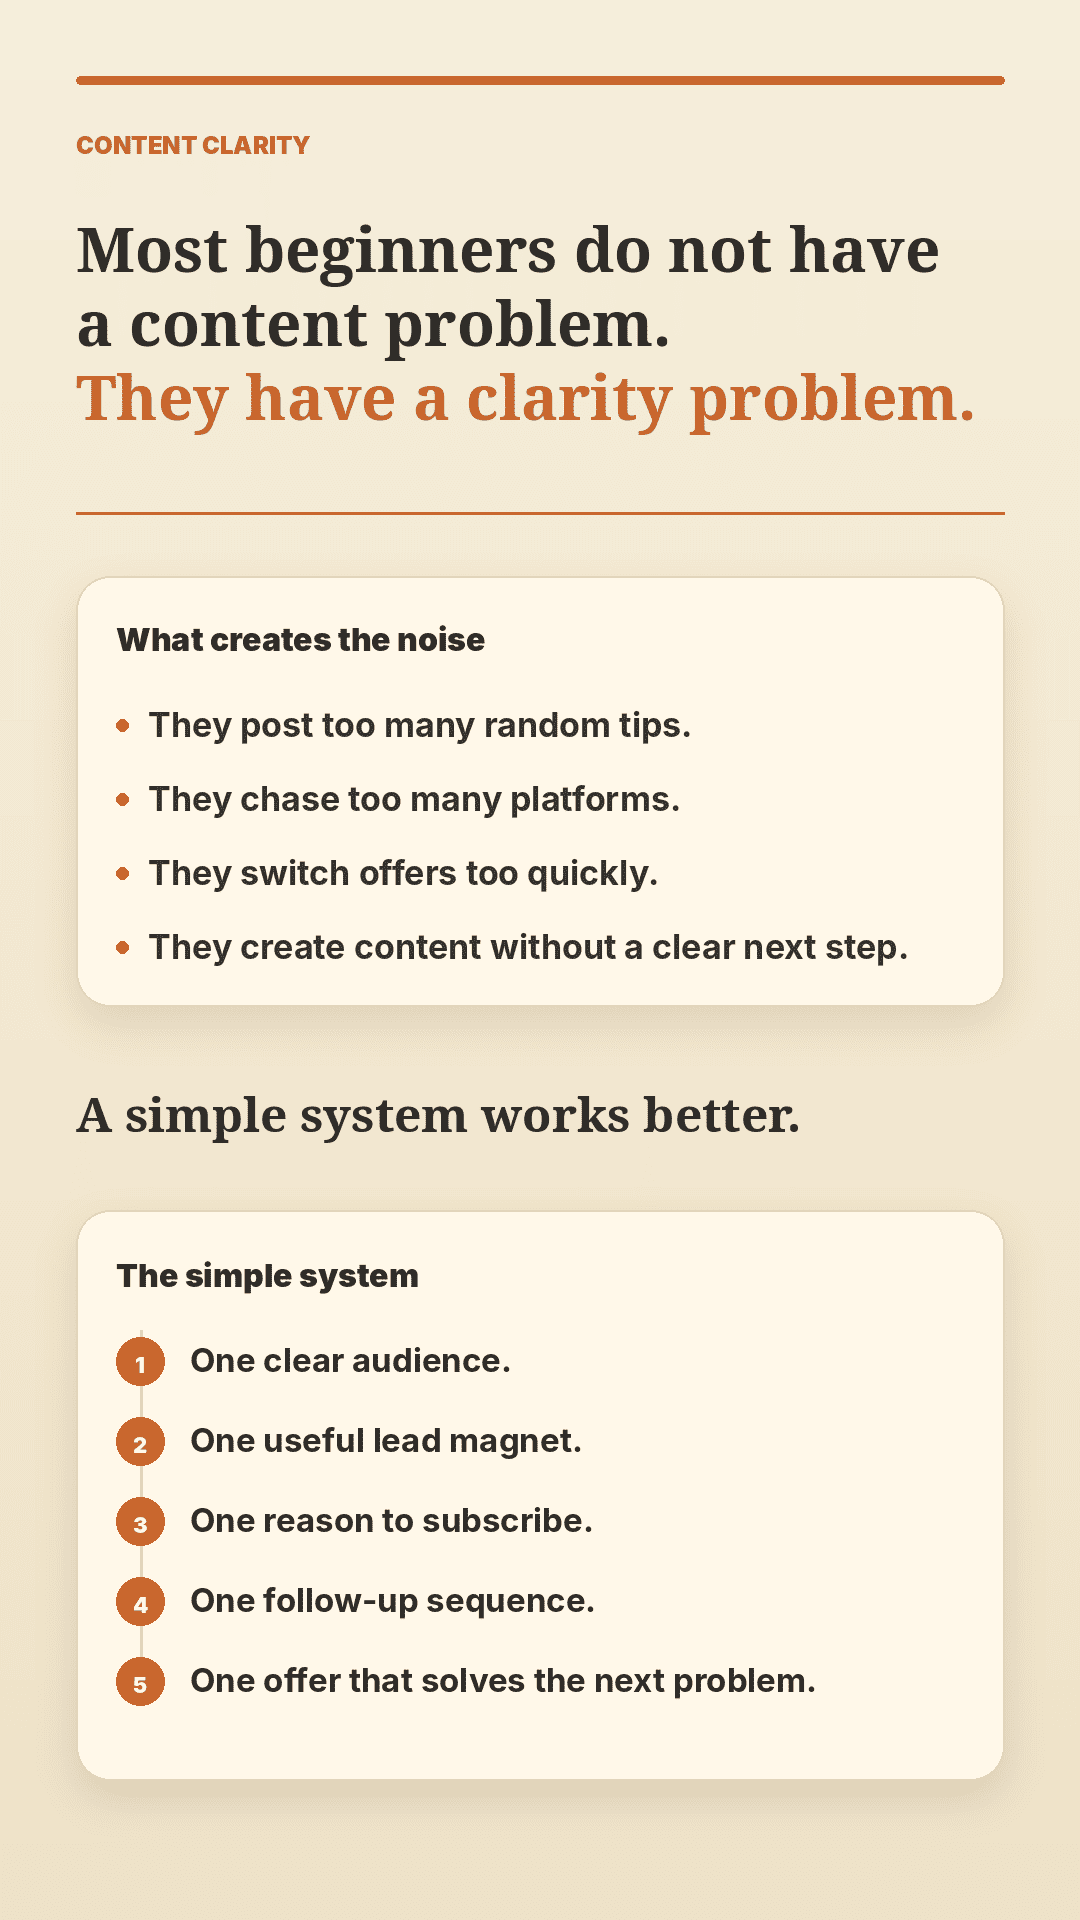
Check Out Some Data Sample Outputs Below
Please note: Below are the raw outputs, from mock text blocks I created just to test this GPT.
None of these graphics below have been edited.
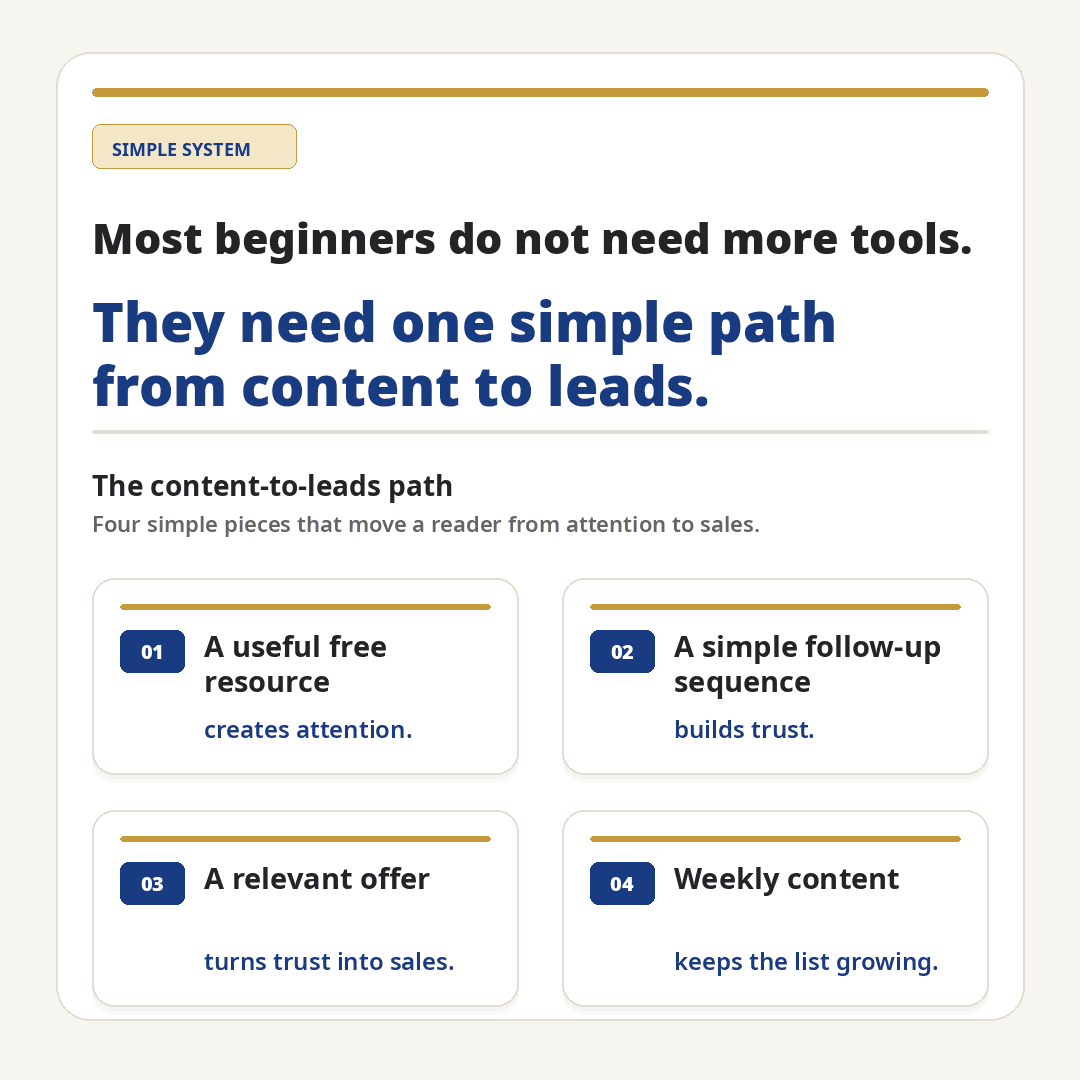
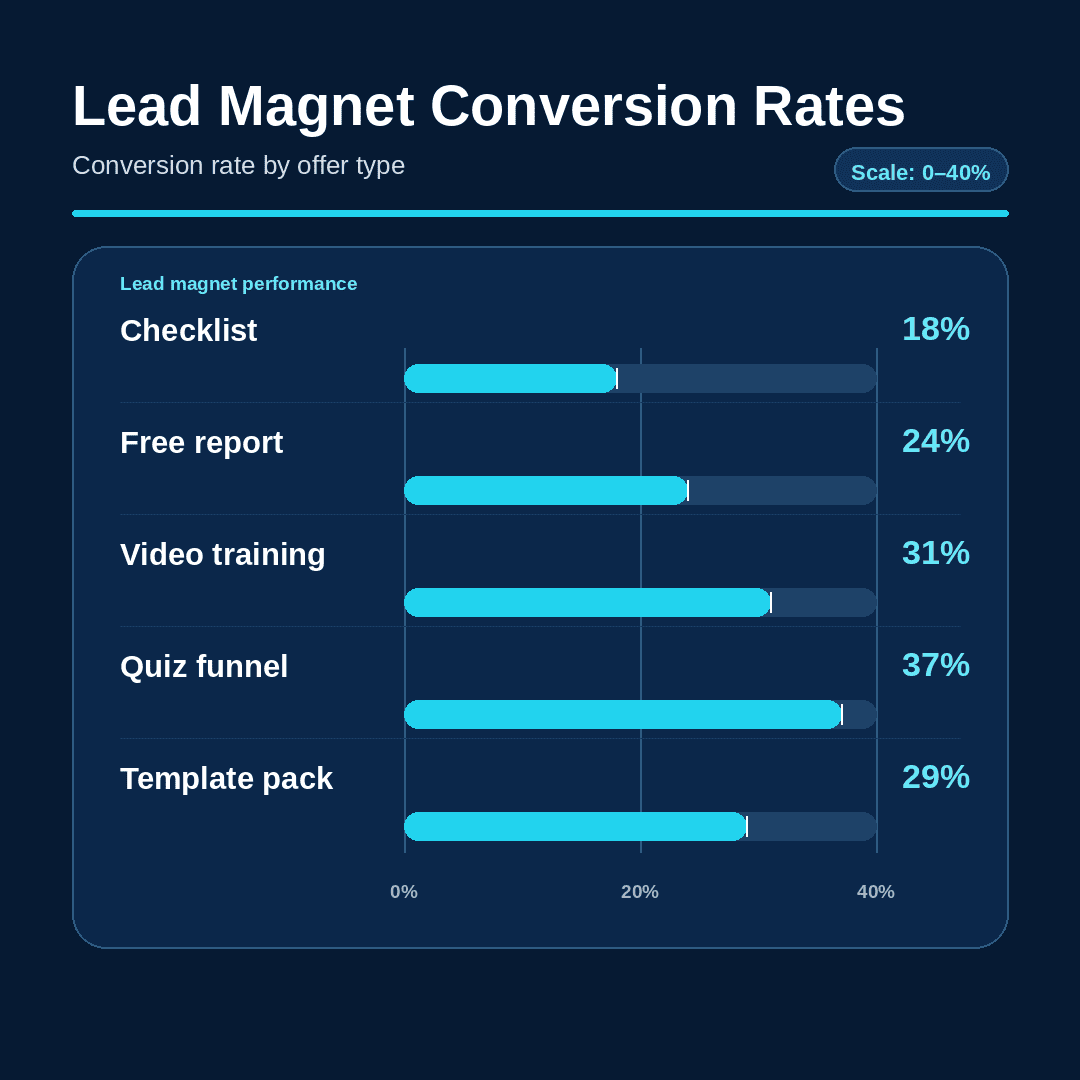
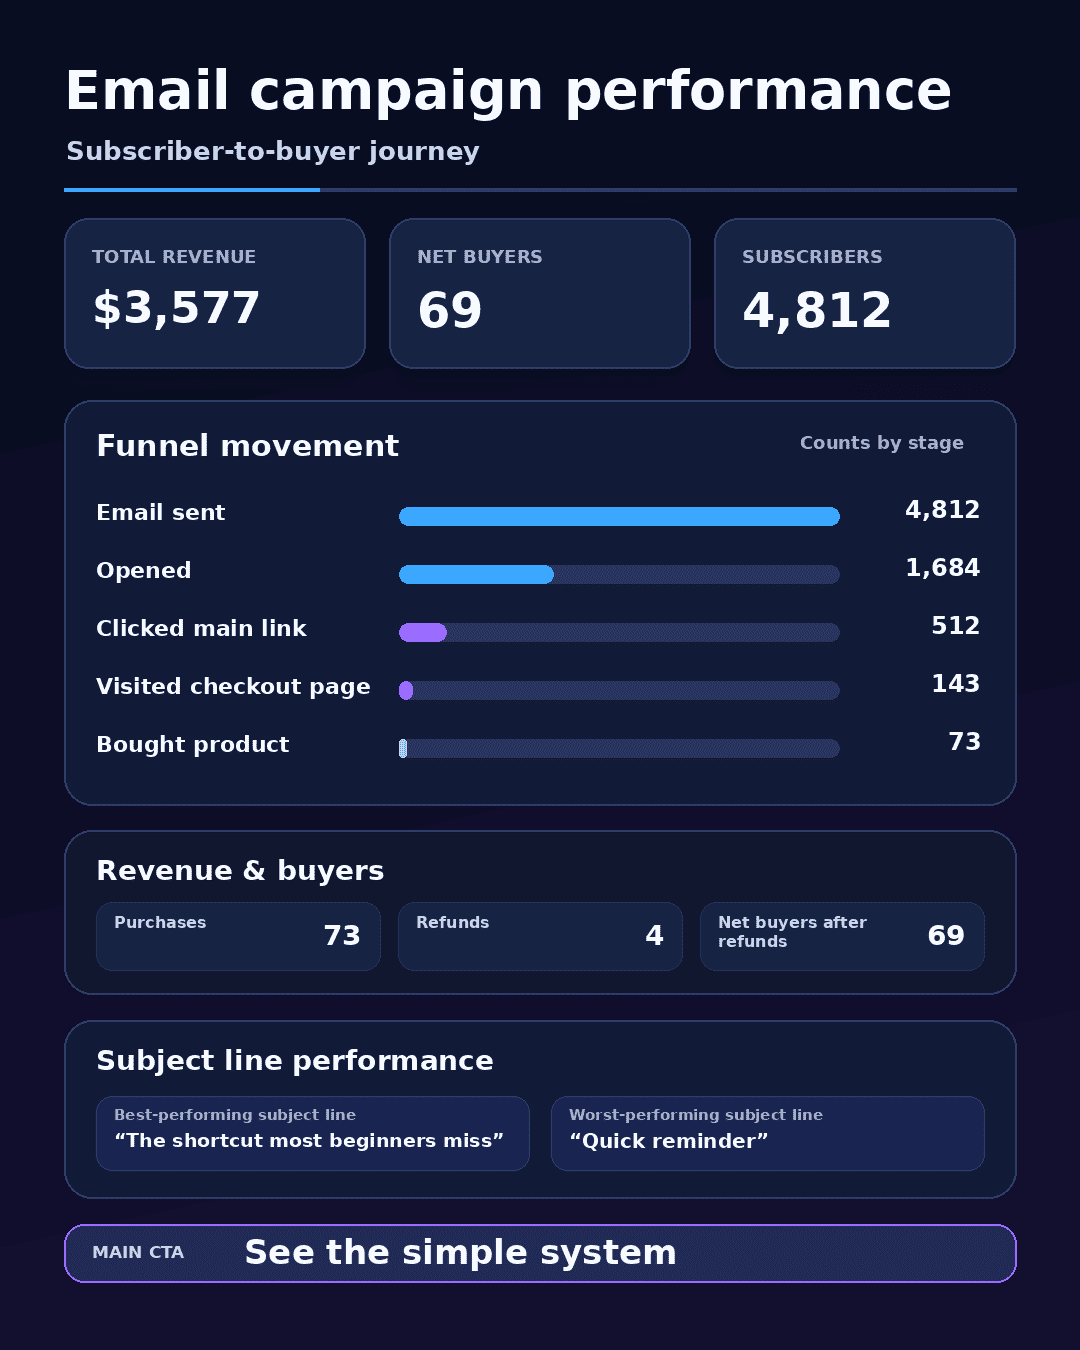

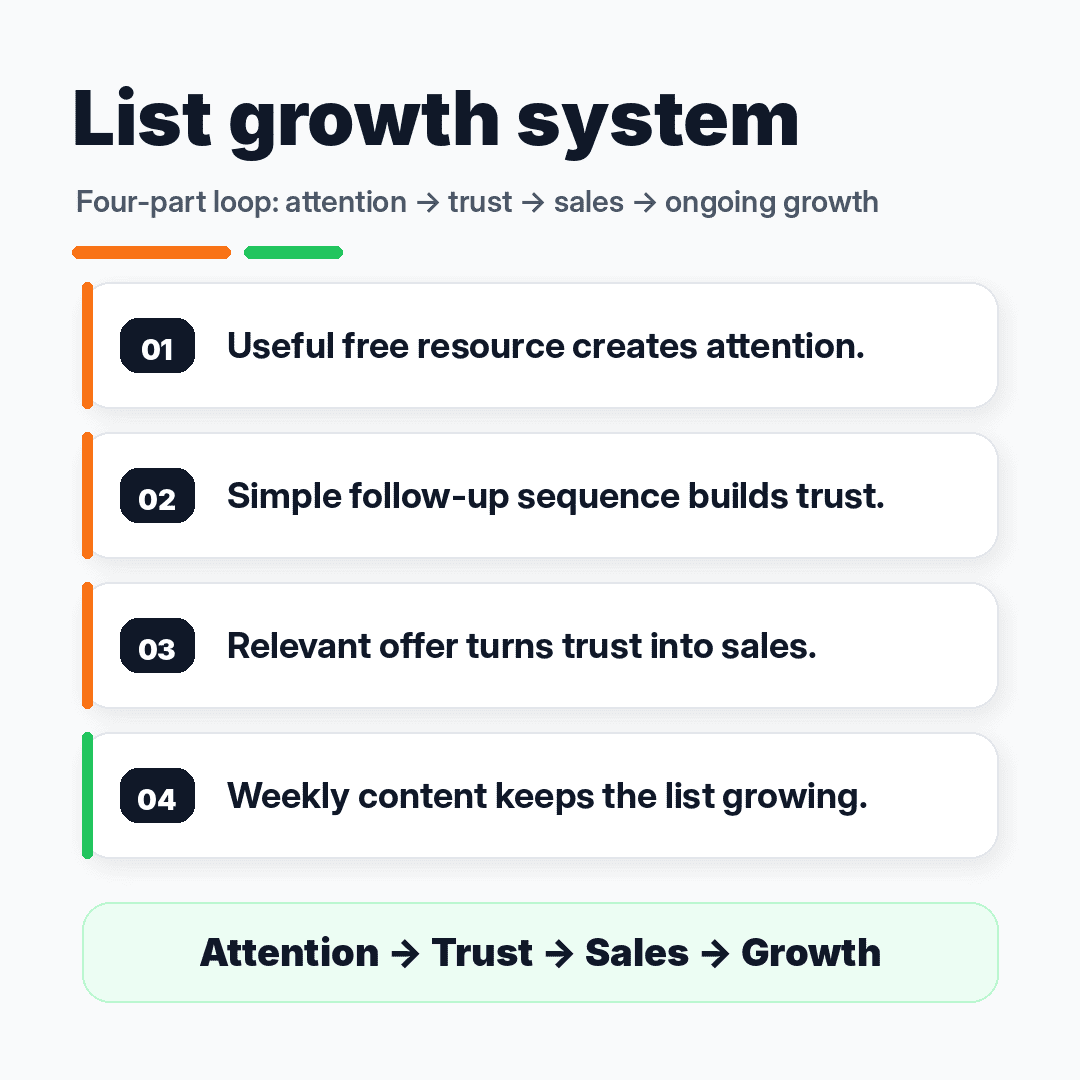
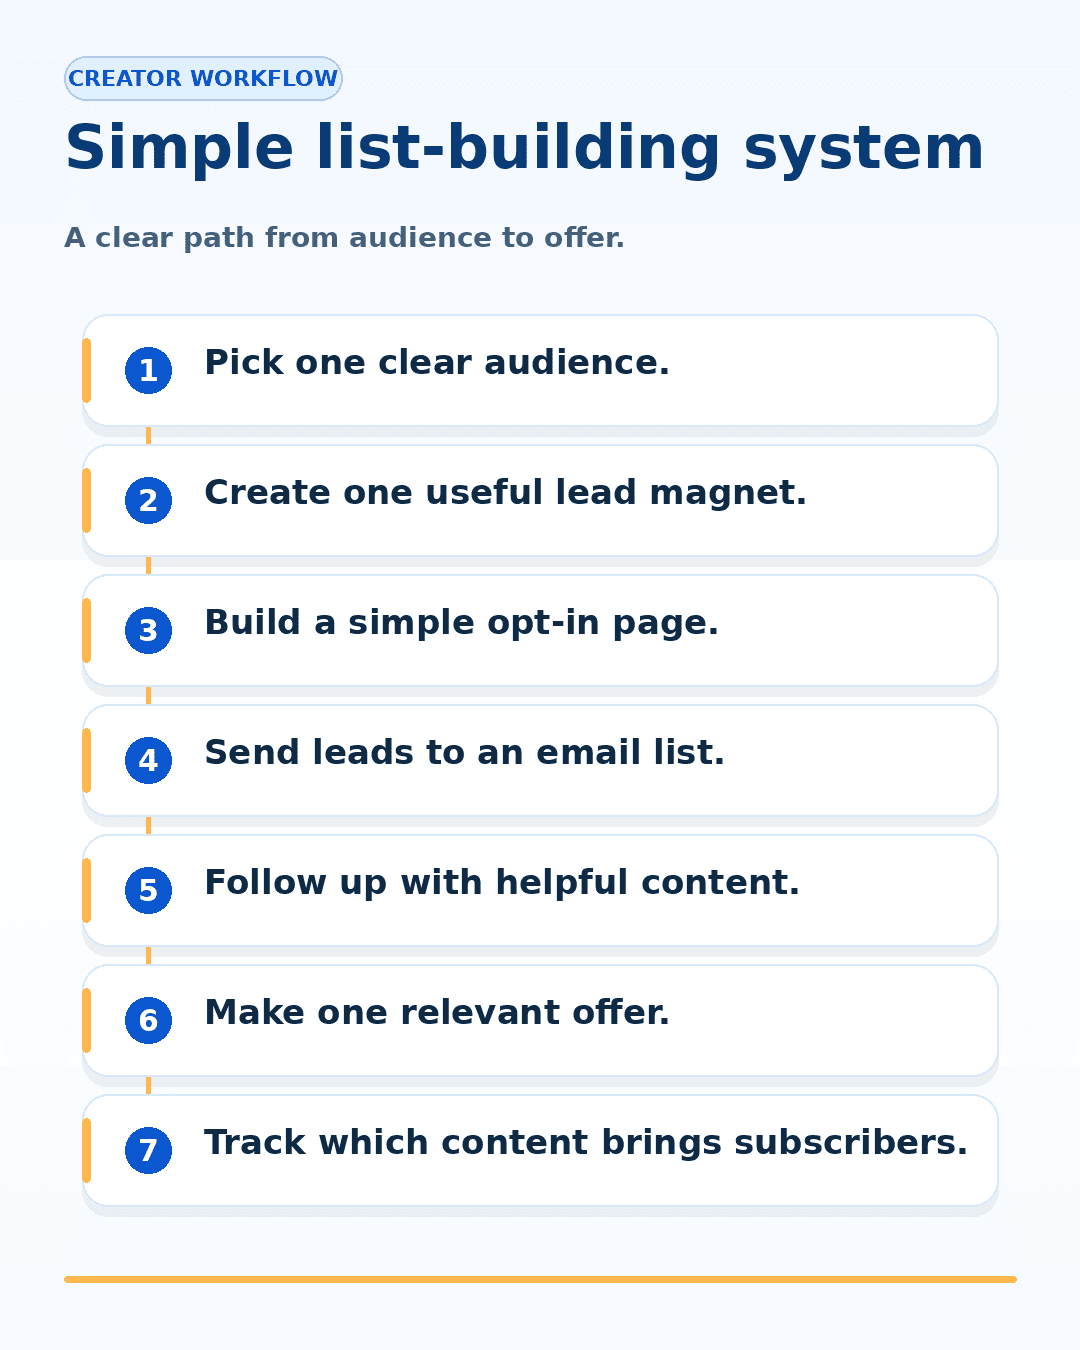
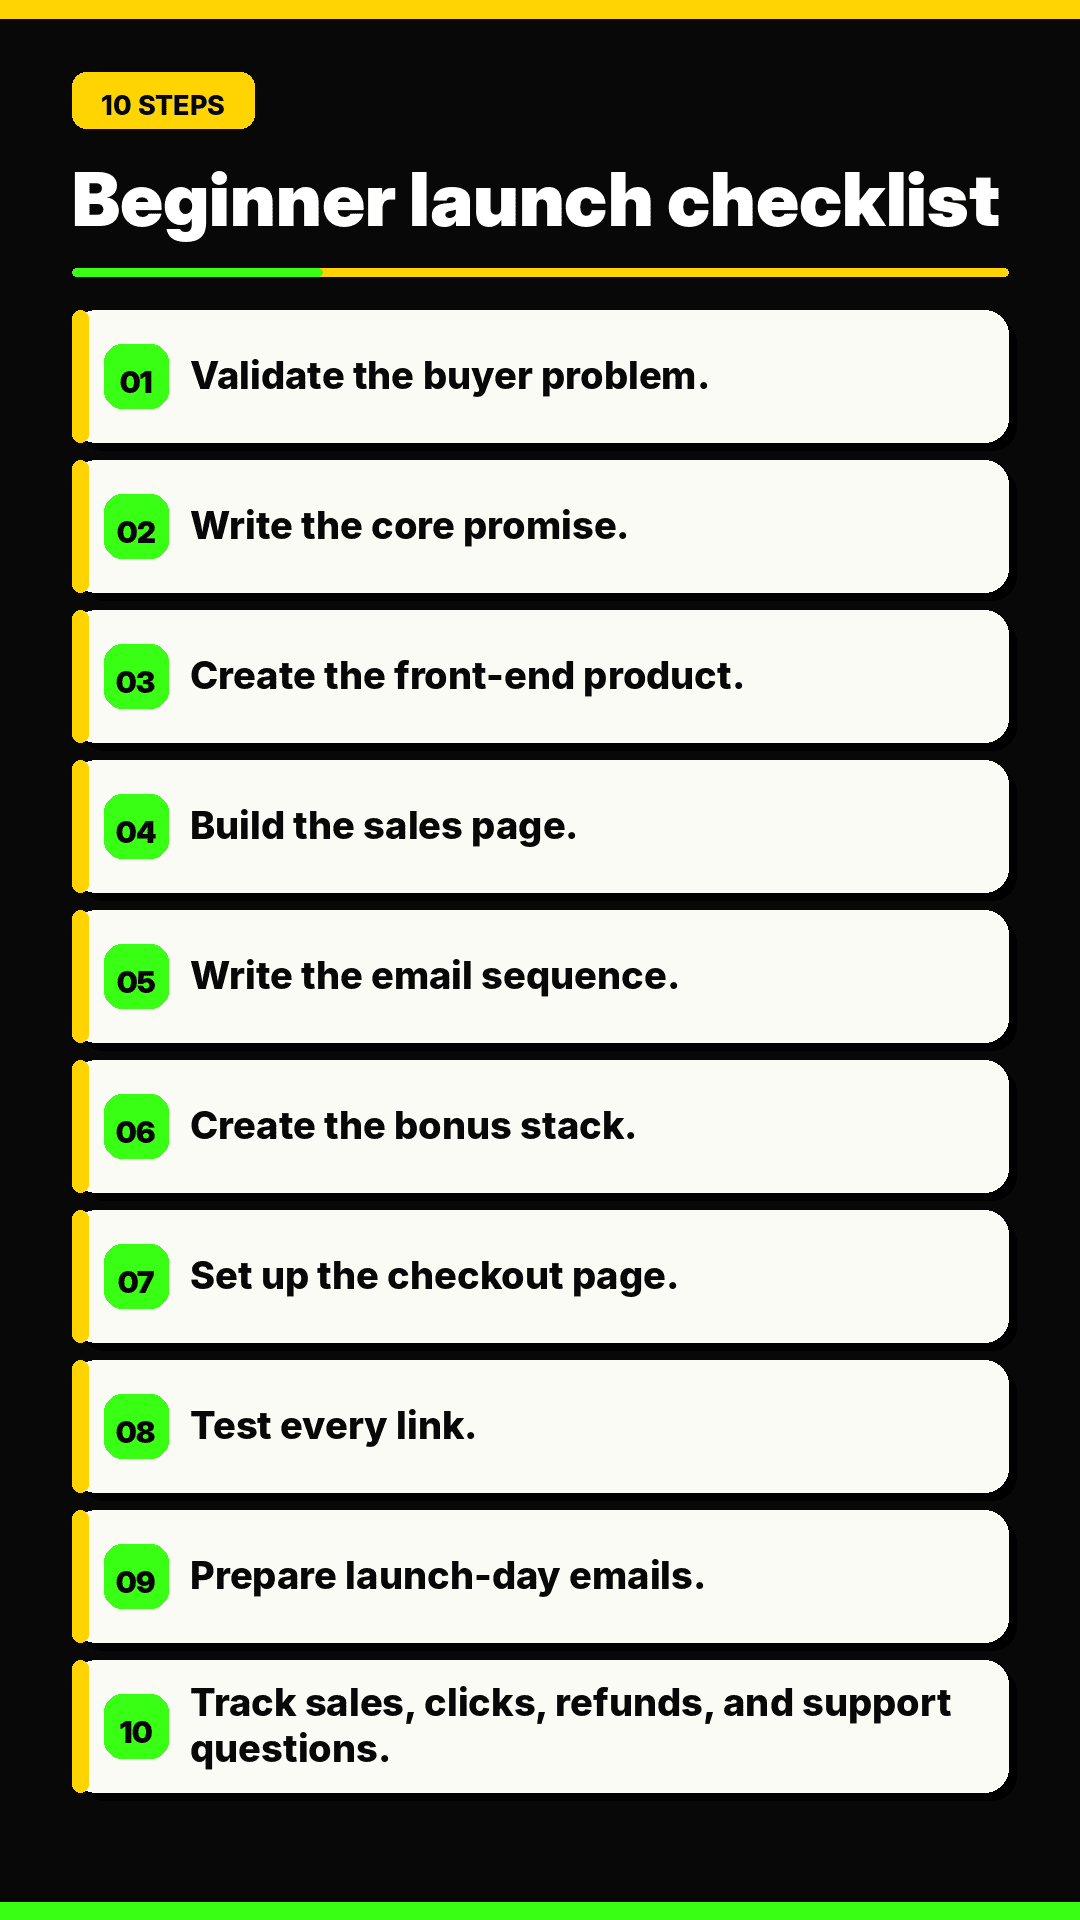
When you get your first draft you can use the graphics you create right away.
And, yes... you can also grab the editable HTML files or ask the GPT to edit stuff like switching colors, adding or removing text, and so on... They're customizable!
You get a clean and to-the-point output that captures the essence of any content at light speed!
These Data Graphics Can Be Used For:
Social Media Content
- Instagram posts
- LinkedIn graphics
- Twitter visuals
- Facebook posts
- Data-driven stories
Product Bonuses
- Bonus reports
- Data summaries
- Case study graphics
- Action guides
- Resource lists
Course Materials
- Lesson visuals
- Module frameworks
- Student case studies
- Implementation checklists
- Training graphics
Client Work
- Status reports
- Proposals
- KPI dashboards
- Onboarding visuals
- Strategy documents
PLR Products
- Rebrandable graphics
- Printable checklists
- Ready-to-sell data visuals
- Bonus packs
- Content bundles
Coaching Materials
- Session visuals
- Client progress trackers
- Homework sheets
- Framework diagrams
- Step-by-step plans
Business Documents
- Internal reports
- Process diagrams
- Reference graphics
- Team performance stats
- Policy visuals
Marketing Assets
- Case study graphics
- Comparison charts
- Downloadable resources
- Ad visuals
- Pre-sell content
But that's not all...
Take Action Now and Get 6 Powerful Bonuses to Boost Your Results
Bonuses Included FREE When You Act Today:
Bonus #1 — PLR License
Rebrand, resell, bundle, or giveaway My AI Data Graphics Generator as your own product.
You can also sell the PLR rights to your buyers.
You keep 100% of the profits.
Value: $497
Bonus #2 — How To Set Up GPTs in ChatGPT
A step-by-step walkthrough showing how to build, customize, and deploy GPTs in minutes.
No technical confusion required.
Value: $97
Bonus #3 — Ready-to-Use Sales Copy
Professionally written sales copy, so you can sell My AI Data Graphics Generator without starting from scratch.
You also get all the HTML codes to replicate this sales letter to the T.
Value: $197
Bonus #4 — 6 Promotional Swipes
Pre-written email campaigns designed to generate clicks, interest, and sales during a promo.
Value: $97
Bonus #5 — 25 Social Media Posts
Multi-platform posts created to promote My AI Data Graphics Generator across social channels.
Value: $147
Bonus #6 — 5 Short-Form Video Scripts
Short scripts designed for Shorts, Reels, and TikTok-style videos.
Use them to promote the system visually.
Value: $147
The Sooner You Get It, the Sooner You & Your Buyers Can Create Better-Looking PDFs
Please note: The dimesale started at $9.95 until we hit $27. The longer you wait, the more you'll pay!
1-Time Payment, No Monthly Fees!
Frequently Asked Questions
What is My AI Data Graphics Generator?
Answer
It is a done-for-you GPT system that turns plain text—like notes, stats, or lists—into polished full-color data graphics.
Does it invent or change my data?
Answer
No. The system is built to preserve the original wording and numbers exactly.
It improves design, layout, spacing, hierarchy, and presentation.
What exactly do I get when I purchase it?
Answer
You get a PLR GPT system built for data graphic creation.
You also receive the PLR license and included launch assets.
That means you can brand it, sell it, bundle it, or use it yourself.
Do I need design skills to use this?
Answer
No. The system handles the design direction for you.
You provide the text and choose a style.
Then it creates the data graphic.
Can I use my own brand colors?
Answer
Yes. Users can choose from 10 built-in styles or provide their own custom colors.
The system will use your palette to guide the visual mood.
Does it use the same template every time?
Answer
No. The GPT is designed to avoid generic repeated templates.
It plans the layout and graphic type around your specific content.
It chooses the best format like a dashboard, chart, or checklist.
What kind of content can I give it?
Answer
You can provide bullets, stats, notes, paragraphs, tables, checklist steps, or campaign data.
Just paste your text.
Does it create clear and readable graphics?
Answer
Yes. The system is built with rules to ensure readability.
It checks for contrast, preserves data integrity, and chooses layouts that make the information easy to understand.
Can I sell this as a client service?
Answer
Yes. You can use it as a data visualization service.
Clients already have data.
They often need it to look finished and professional.
Is this real PLR?
Answer
Yes. You can rebrand it, resell it, bundle it, or give it away.
You control pricing, positioning, and customer access.
Are there any monthly fees or subscriptions?
Answer
No. This is a one-time purchase.
The PLR license has no ongoing fees.
How do I get instant access?
Answer
Click the button below now.
Please note: The dimesale started at $9.95 until we hit $27. The longer you wait, the more you'll pay!
1-Time Payment, No Monthly Fees!
Let's Recap All You Get Today:
Main Product Included
My AI Data Graphics Generator
A premium GPT that turns plain text into polished full-color data graphics.
It preserves the original wording while improving the visual presentation.
Main Product
Included
Bonuses Included FREE When You Act Today:
Bonus #1 — PLR License
Rebrand, resell, bundle, or giveaway My AI Data Graphics Generator as your own product.
You keep 100% of the profits.
Value: $497
Bonus #2 — How To Set Up GPTs in ChatGPT
A step-by-step walkthrough showing how to build, customize, and deploy GPTs in minutes.
Value: $97
Bonus #3 — Ready-to-Use Sales Copy
Professionally written sales copy, so you can sell the product without starting from scratch.
Value: $197
Bonus #4 — 6 Promotional Swipes
Pre-written email campaigns designed to generate clicks, urgency, and conversions during a promo.
Value: $97
Bonus #5 — 25 Social Media Posts
Multi-platform posts created to promote My AI Data Graphics Generator.
Value: $147
Bonus #6 — 5 Short-Form Video Scripts
Scroll-stopping scripts designed for Shorts, Reels, and TikTok-style videos.
Value: $147
Yours Today, With The 6 Free Bonuses...
Please note: The dimesale started at $9.95 until we hit $27. The longer you wait, the more you'll pay!
1-Time Payment, No Monthly Fees!
See you inside,
Michel Sirois

Income Disclosure | Terms & Conditions | DMCA Notice | FTC Statement | Privacy | Contact
© 2013-2026 Scalable PLR Products. All Rights Reserved.
